mirror of
https://github.com/go-gitea/gitea.git
synced 2025-12-12 23:39:34 +01:00
This PR adds gitea-mixin, configurable Grafana dashboards (and potentially prometheus alerts+recording rules) based on Gitea [metrics](https://docs.gitea.io/en-us/config-cheat-sheet/#metrics-metrics). The overview dashboard is described using jsonnet and grafonnet library: https://grafana.github.io/grafonnet-lib/ Mixins help to define dashboard and alerts as code so they can be collaboratively improved by the users. 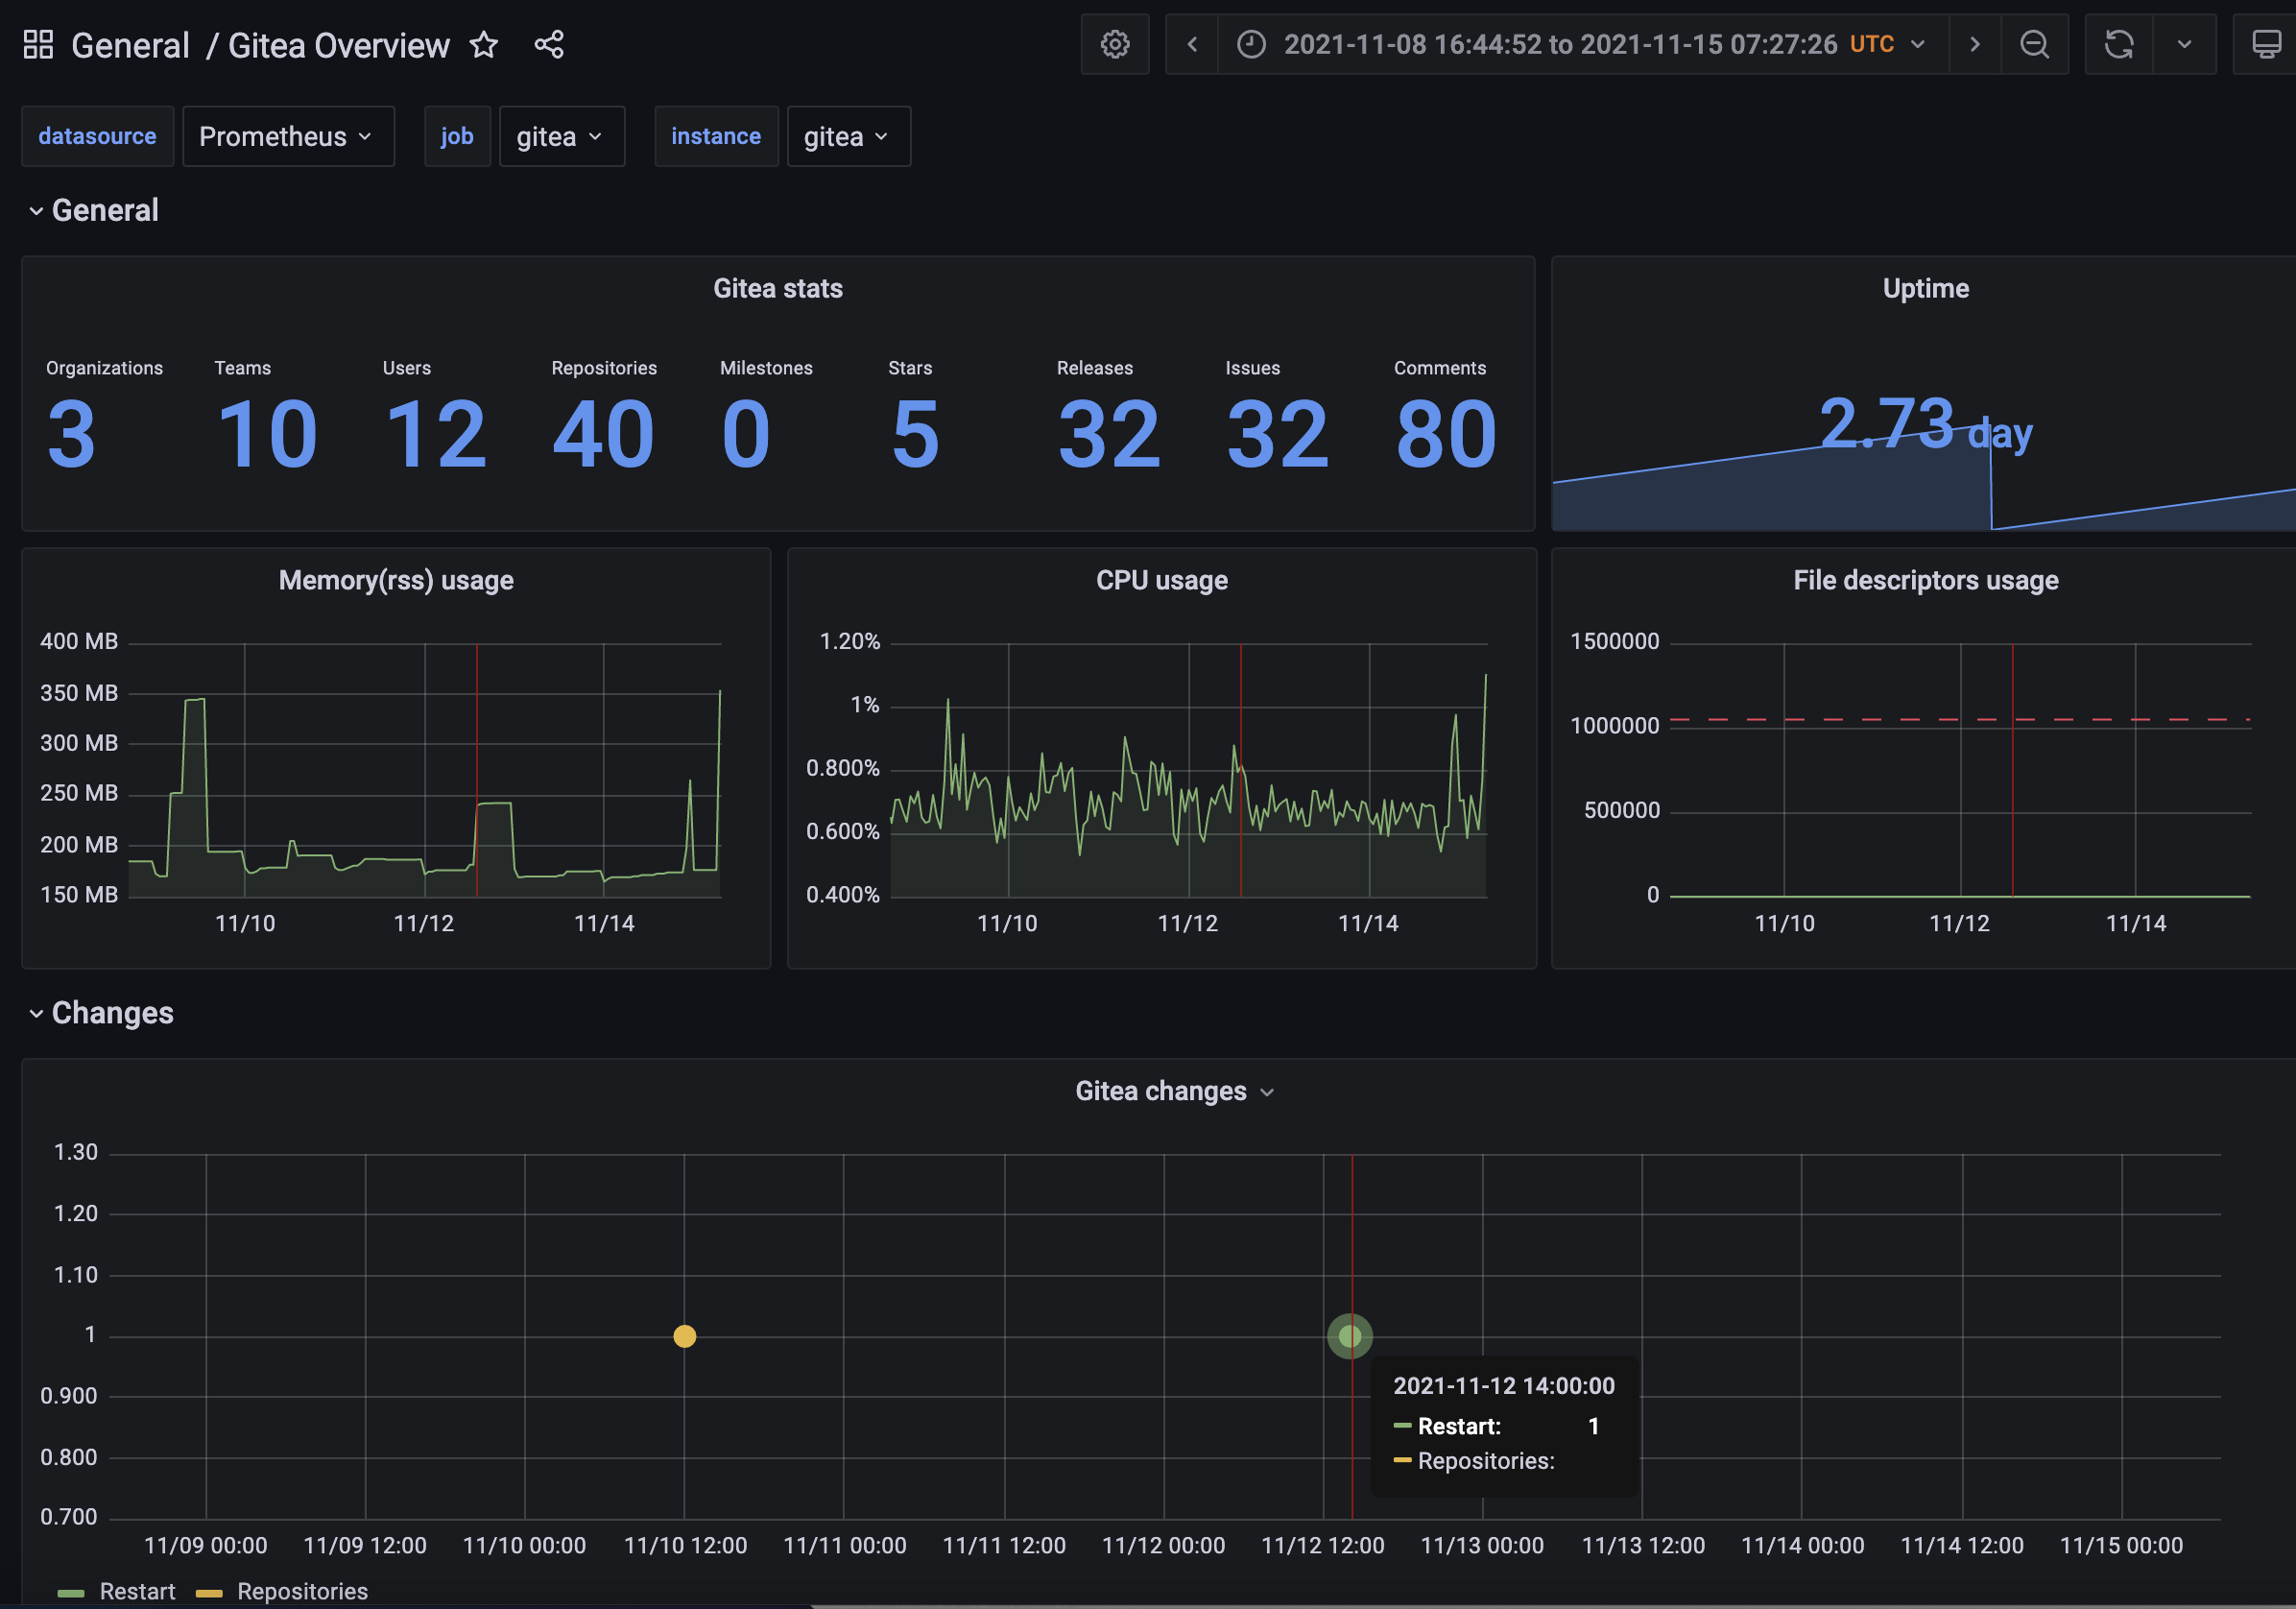 __ ## Generate config files You can manually generate dashboards, but first you should install some tools: ```bash go get github.com/jsonnet-bundler/jsonnet-bundler/cmd/jb go get github.com/google/go-jsonnet/cmd/jsonnet # or in brew: brew install go-jsonnet ``` For linting and formatting, you would also need `mixtool` and `jsonnetfmt` installed. If you have a working Go development environment, it's easiest to run the following: ```bash go get github.com/monitoring-mixins/mixtool/cmd/mixtool go get github.com/google/go-jsonnet/cmd/jsonnetfmt ``` The files in `dashboards_out` need to be imported into your Grafana server. The exact details will be depending on your environment. Edit `config.libsonnet` (for example, list of Gitea metrics to be shown under stats can be adjusted). if required and then build JSON dashboard files for Grafana: ```bash make ``` For more about mixins, please see: https://github.com/monitoring-mixins/docs https://www.youtube.com/watch?v=GDdnL5R_l-Y* add gitea mixin * remove alerts/rules * gitea-mixin: add interval factor of 1/2 to remove duplicated change events * gitea-mixin: fix changes panel, add aggregation interval for changes panel * gitea-mixin: add totals singlestat * gitea mixin: switch change graph to timeseries type * add color overrides for issue labels * bump grafonnet version * gitea-mixin: convert graphs to timeseries * gitea-mixin: make fmt * gitea-mixin: add .PHONE in Makefile * gitea-mixin: add time configration * gitea-mixin: make fmt and collapse addPanel grid * gitea-mixin: add static ids for shared panels * gitea-mixin: add flags showIssuesByRepository, showIssuesByLabel to show/hide corresponding panels * gitea-mixin: update aggregation interval * gitea-mixin: update defaults * gitea-mixin: update panel names * rename dir to gitea-monitoring-mixin * gitea-mixin: add gitea_issues_open, gitea_issues_closed metrics * gitea-mixin: update visible name for datasource * gitea-mixin: update README Co-authored-by: Lunny Xiao <xiaolunwen@gmail.com> Co-authored-by: zeripath <art27@cantab.net>
462 lines
12 KiB
Jsonnet
462 lines
12 KiB
Jsonnet
local grafana = import 'github.com/grafana/grafonnet-lib/grafonnet/grafana.libsonnet';
|
|
local prometheus = grafana.prometheus;
|
|
|
|
local addIssueLabelsOverrides(labels) =
|
|
{
|
|
fieldConfig+: {
|
|
overrides+: [
|
|
{
|
|
matcher: {
|
|
id: 'byRegexp',
|
|
options: label.label,
|
|
},
|
|
properties: [
|
|
{
|
|
id: 'color',
|
|
value: {
|
|
fixedColor: label.color,
|
|
mode: 'fixed',
|
|
},
|
|
},
|
|
],
|
|
}
|
|
for label in labels
|
|
],
|
|
},
|
|
};
|
|
|
|
{
|
|
|
|
grafanaDashboards+:: {
|
|
|
|
local giteaSelector = 'job="$job", instance="$instance"',
|
|
local giteaStatsPanel =
|
|
grafana.statPanel.new(
|
|
'Gitea stats',
|
|
datasource='$datasource',
|
|
reducerFunction='lastNotNull',
|
|
graphMode='none',
|
|
colorMode='value',
|
|
)
|
|
.addTargets(
|
|
[
|
|
prometheus.target(expr='%s{%s}' % [metric.name, giteaSelector], legendFormat=metric.description, intervalFactor=10)
|
|
for metric in $._config.giteaStatMetrics
|
|
]
|
|
)
|
|
+ {
|
|
fieldConfig+: {
|
|
defaults+: {
|
|
color: {
|
|
fixedColor: 'blue',
|
|
mode: 'fixed',
|
|
},
|
|
},
|
|
},
|
|
},
|
|
|
|
local giteaUptimePanel =
|
|
grafana.statPanel.new(
|
|
'Uptime',
|
|
datasource='$datasource',
|
|
reducerFunction='last',
|
|
graphMode='area',
|
|
colorMode='value',
|
|
)
|
|
.addTarget(prometheus.target(expr='time()-process_start_time_seconds{%s}' % giteaSelector, intervalFactor=1))
|
|
+ {
|
|
fieldConfig+: {
|
|
defaults+: {
|
|
color: {
|
|
fixedColor: 'blue',
|
|
mode: 'fixed',
|
|
},
|
|
unit: 's',
|
|
},
|
|
},
|
|
},
|
|
|
|
local giteaMemoryPanel =
|
|
grafana.graphPanel.new(
|
|
'Memory usage',
|
|
datasource='$datasource'
|
|
)
|
|
.addTarget(prometheus.target(expr='process_resident_memory_bytes{%s}' % giteaSelector, intervalFactor=2))
|
|
+ {
|
|
type: 'timeseries',
|
|
options+: {
|
|
tooltip: {
|
|
mode: 'multi',
|
|
},
|
|
legend+: {
|
|
displayMode: 'hidden',
|
|
},
|
|
},
|
|
fieldConfig+: {
|
|
defaults+: {
|
|
custom+: {
|
|
lineInterpolation: 'smooth',
|
|
fillOpacity: 15,
|
|
},
|
|
color: {
|
|
fixedColor: 'green',
|
|
mode: 'fixed',
|
|
},
|
|
unit: 'decbytes',
|
|
},
|
|
},
|
|
},
|
|
|
|
local giteaCpuPanel =
|
|
grafana.graphPanel.new(
|
|
'CPU usage',
|
|
datasource='$datasource'
|
|
)
|
|
.addTarget(prometheus.target(expr='rate(process_cpu_seconds_total{%s}[$__rate_interval])*100' % giteaSelector, intervalFactor=2))
|
|
+ {
|
|
type: 'timeseries',
|
|
options+: {
|
|
tooltip: {
|
|
mode: 'multi',
|
|
},
|
|
legend+: {
|
|
displayMode: 'hidden',
|
|
},
|
|
},
|
|
fieldConfig+: {
|
|
defaults+: {
|
|
custom+: {
|
|
lineInterpolation: 'smooth',
|
|
gradientMode: 'scheme',
|
|
fillOpacity: 15,
|
|
axisSoftMin: 0,
|
|
axisSoftMax: 0,
|
|
},
|
|
color: {
|
|
mode: 'continuous-GrYlRd', // from green to red (100%)
|
|
},
|
|
unit: 'percent',
|
|
},
|
|
overrides: [
|
|
{
|
|
matcher: {
|
|
id: 'byRegexp',
|
|
options: '.+',
|
|
},
|
|
properties: [
|
|
{
|
|
id: 'max',
|
|
value: 100,
|
|
},
|
|
{
|
|
id: 'min',
|
|
value: 0,
|
|
},
|
|
],
|
|
},
|
|
],
|
|
},
|
|
},
|
|
|
|
local giteaFileDescriptorsPanel =
|
|
grafana.graphPanel.new(
|
|
'File descriptors usage',
|
|
datasource='$datasource',
|
|
)
|
|
.addTarget(prometheus.target(expr='process_open_fds{%s}' % giteaSelector, intervalFactor=2))
|
|
.addTarget(prometheus.target(expr='process_max_fds{%s}' % giteaSelector, intervalFactor=2))
|
|
.addSeriesOverride(
|
|
{
|
|
alias: '/process_max_fds.+/',
|
|
color: '#F2495C', // red
|
|
dashes: true,
|
|
fill: 0,
|
|
},
|
|
)
|
|
+ {
|
|
type: 'timeseries',
|
|
options+: {
|
|
tooltip: {
|
|
mode: 'multi',
|
|
},
|
|
legend+: {
|
|
displayMode: 'hidden',
|
|
},
|
|
},
|
|
fieldConfig+: {
|
|
defaults+: {
|
|
custom+: {
|
|
lineInterpolation: 'smooth',
|
|
gradientMode: 'scheme',
|
|
fillOpacity: 0,
|
|
},
|
|
color: {
|
|
fixedColor: 'green',
|
|
mode: 'fixed',
|
|
},
|
|
unit: '',
|
|
},
|
|
overrides: [
|
|
{
|
|
matcher: {
|
|
id: 'byFrameRefID',
|
|
options: 'B',
|
|
},
|
|
properties: [
|
|
{
|
|
id: 'custom.lineStyle',
|
|
value: {
|
|
fill: 'dash',
|
|
dash: [
|
|
10,
|
|
10,
|
|
],
|
|
},
|
|
},
|
|
{
|
|
id: 'color',
|
|
value: {
|
|
mode: 'fixed',
|
|
fixedColor: 'red',
|
|
},
|
|
},
|
|
],
|
|
},
|
|
],
|
|
},
|
|
},
|
|
|
|
local giteaChangesPanelPrototype =
|
|
grafana.graphPanel.new(
|
|
'',
|
|
datasource='$datasource',
|
|
interval='$agg_interval',
|
|
maxDataPoints=10000,
|
|
)
|
|
+ {
|
|
type: 'timeseries',
|
|
options+: {
|
|
tooltip: {
|
|
mode: 'multi',
|
|
},
|
|
legend+: {
|
|
calcs+: [
|
|
'sum',
|
|
],
|
|
},
|
|
},
|
|
fieldConfig+: {
|
|
defaults+: {
|
|
noValue: '0',
|
|
custom+: {
|
|
drawStyle: 'bars',
|
|
barAlignment: -1,
|
|
fillOpacity: 50,
|
|
gradientMode: 'hue',
|
|
pointSize: 1,
|
|
lineWidth: 0,
|
|
stacking: {
|
|
group: 'A',
|
|
mode: 'normal',
|
|
},
|
|
},
|
|
},
|
|
},
|
|
},
|
|
|
|
local giteaChangesPanelAll =
|
|
giteaChangesPanelPrototype
|
|
.addTarget(prometheus.target(expr='changes(process_start_time_seconds{%s}[$__interval]) > 0' % [giteaSelector], legendFormat='Restarts', intervalFactor=1))
|
|
.addTargets(
|
|
[
|
|
prometheus.target(expr='floor(delta(%s{%s}[$__interval])) > 0' % [metric.name, giteaSelector], legendFormat=metric.description, intervalFactor=1)
|
|
for metric in $._config.giteaStatMetrics
|
|
]
|
|
) + { id: 200 }, // some unique number, beyond the maximum number of panels in the dashboard,
|
|
|
|
local giteaChangesPanelTotal =
|
|
grafana.statPanel.new(
|
|
'Changes',
|
|
datasource='-- Dashboard --',
|
|
reducerFunction='sum',
|
|
graphMode='none',
|
|
textMode='value_and_name',
|
|
colorMode='value',
|
|
)
|
|
+ {
|
|
targets+: [
|
|
{
|
|
panelId: giteaChangesPanelAll.id,
|
|
refId: 'A',
|
|
},
|
|
],
|
|
}
|
|
+ {
|
|
fieldConfig+: {
|
|
defaults+: {
|
|
color: {
|
|
mode: 'palette-classic',
|
|
},
|
|
},
|
|
},
|
|
},
|
|
|
|
local giteaChangesByRepositories =
|
|
giteaChangesPanelPrototype
|
|
.addTarget(prometheus.target(expr='floor(increase(gitea_issues_by_repository{%s}[$__interval])) > 0' % [giteaSelector], legendFormat='{{ repository }}', intervalFactor=1))
|
|
+ { id: 210 }, // some unique number, beyond the maximum number of panels in the dashboard,
|
|
|
|
local giteaChangesByRepositoriesTotal =
|
|
grafana.statPanel.new(
|
|
'Issues by repository',
|
|
datasource='-- Dashboard --',
|
|
reducerFunction='sum',
|
|
graphMode='none',
|
|
textMode='value_and_name',
|
|
colorMode='value',
|
|
)
|
|
+ {
|
|
id: 211,
|
|
targets+: [
|
|
{
|
|
panelId: giteaChangesByRepositories.id,
|
|
refId: 'A',
|
|
},
|
|
],
|
|
}
|
|
+ {
|
|
fieldConfig+: {
|
|
defaults+: {
|
|
color: {
|
|
mode: 'palette-classic',
|
|
},
|
|
},
|
|
},
|
|
},
|
|
|
|
local giteaChangesByLabel =
|
|
giteaChangesPanelPrototype
|
|
.addTarget(prometheus.target(expr='floor(increase(gitea_issues_by_label{%s}[$__interval])) > 0' % [giteaSelector], legendFormat='{{ label }}', intervalFactor=1))
|
|
+ addIssueLabelsOverrides($._config.issueLabels)
|
|
+ { id: 220 }, // some unique number, beyond the maximum number of panels in the dashboard,
|
|
|
|
local giteaChangesByLabelTotal =
|
|
grafana.statPanel.new(
|
|
'Issues by labels',
|
|
datasource='-- Dashboard --',
|
|
reducerFunction='sum',
|
|
graphMode='none',
|
|
textMode='value_and_name',
|
|
colorMode='value',
|
|
)
|
|
+ addIssueLabelsOverrides($._config.issueLabels)
|
|
+ {
|
|
id: 221,
|
|
targets+: [
|
|
{
|
|
panelId: giteaChangesByLabel.id,
|
|
refId: 'A',
|
|
},
|
|
],
|
|
}
|
|
+ {
|
|
fieldConfig+: {
|
|
defaults+: {
|
|
color: {
|
|
mode: 'palette-classic',
|
|
},
|
|
},
|
|
},
|
|
},
|
|
|
|
'gitea-overview.json':
|
|
grafana.dashboard.new(
|
|
'%s Overview' % $._config.dashboardNamePrefix,
|
|
time_from='%s' % $._config.dashboardPeriod,
|
|
editable=false,
|
|
tags=($._config.dashboardTags),
|
|
timezone='%s' % $._config.dashboardTimezone,
|
|
refresh='%s' % $._config.dashboardRefresh,
|
|
graphTooltip='shared_crosshair',
|
|
uid='gitea-overview'
|
|
)
|
|
.addTemplate(
|
|
{
|
|
current: {
|
|
text: 'Prometheus',
|
|
value: 'Prometheus',
|
|
},
|
|
hide: 0,
|
|
label: 'Data Source',
|
|
name: 'datasource',
|
|
options: [],
|
|
query: 'prometheus',
|
|
refresh: 1,
|
|
regex: '',
|
|
type: 'datasource',
|
|
},
|
|
)
|
|
.addTemplate(
|
|
{
|
|
hide: 0,
|
|
label: null,
|
|
name: 'job',
|
|
options: [],
|
|
query: 'label_values(gitea_organizations, job)',
|
|
refresh: 1,
|
|
regex: '',
|
|
type: 'query',
|
|
},
|
|
)
|
|
.addTemplate(
|
|
{
|
|
hide: 0,
|
|
label: null,
|
|
name: 'instance',
|
|
options: [],
|
|
query: 'label_values(gitea_organizations{job="$job"}, instance)',
|
|
refresh: 1,
|
|
regex: '',
|
|
type: 'query',
|
|
},
|
|
)
|
|
.addTemplate(
|
|
{
|
|
hide: 0,
|
|
label: 'aggregation interval',
|
|
name: 'agg_interval',
|
|
auto_min: '1m',
|
|
auto: true,
|
|
query: '1m,10m,1h,1d,7d',
|
|
type: 'interval',
|
|
},
|
|
)
|
|
.addPanel(grafana.row.new(title='General'), gridPos={ x: 0, y: 0, w: 0, h: 0 },)
|
|
.addPanel(giteaStatsPanel, gridPos={ x: 0, y: 0, w: 16, h: 4 })
|
|
.addPanel(giteaUptimePanel, gridPos={ x: 16, y: 0, w: 8, h: 4 })
|
|
.addPanel(giteaMemoryPanel, gridPos={ x: 0, y: 4, w: 8, h: 6 })
|
|
.addPanel(giteaCpuPanel, gridPos={ x: 8, y: 4, w: 8, h: 6 })
|
|
.addPanel(giteaFileDescriptorsPanel, gridPos={ x: 16, y: 4, w: 8, h: 6 })
|
|
.addPanel(grafana.row.new(title='Changes', collapse=false), gridPos={ x: 0, y: 10, w: 24, h: 8 })
|
|
.addPanel(giteaChangesPanelTotal, gridPos={ x: 0, y: 12, w: 6, h: 8 })
|
|
+ // use patching instead of .addPanel() to keep static ids
|
|
{
|
|
panels+: std.flattenArrays([
|
|
[
|
|
giteaChangesPanelAll { gridPos: { x: 6, y: 12, w: 18, h: 8 } },
|
|
],
|
|
if $._config.showIssuesByRepository then
|
|
[
|
|
giteaChangesByRepositoriesTotal { gridPos: { x: 0, y: 20, w: 6, h: 8 } },
|
|
giteaChangesByRepositories { gridPos: { x: 6, y: 20, w: 18, h: 8 } },
|
|
] else [],
|
|
if $._config.showIssuesByLabel then
|
|
[
|
|
giteaChangesByLabelTotal { gridPos: { x: 0, y: 28, w: 6, h: 8 } },
|
|
giteaChangesByLabel { gridPos: { x: 6, y: 28, w: 18, h: 8 } },
|
|
] else [],
|
|
]),
|
|
},
|
|
},
|
|
}
|